A factory in 3D: a year of prototyping
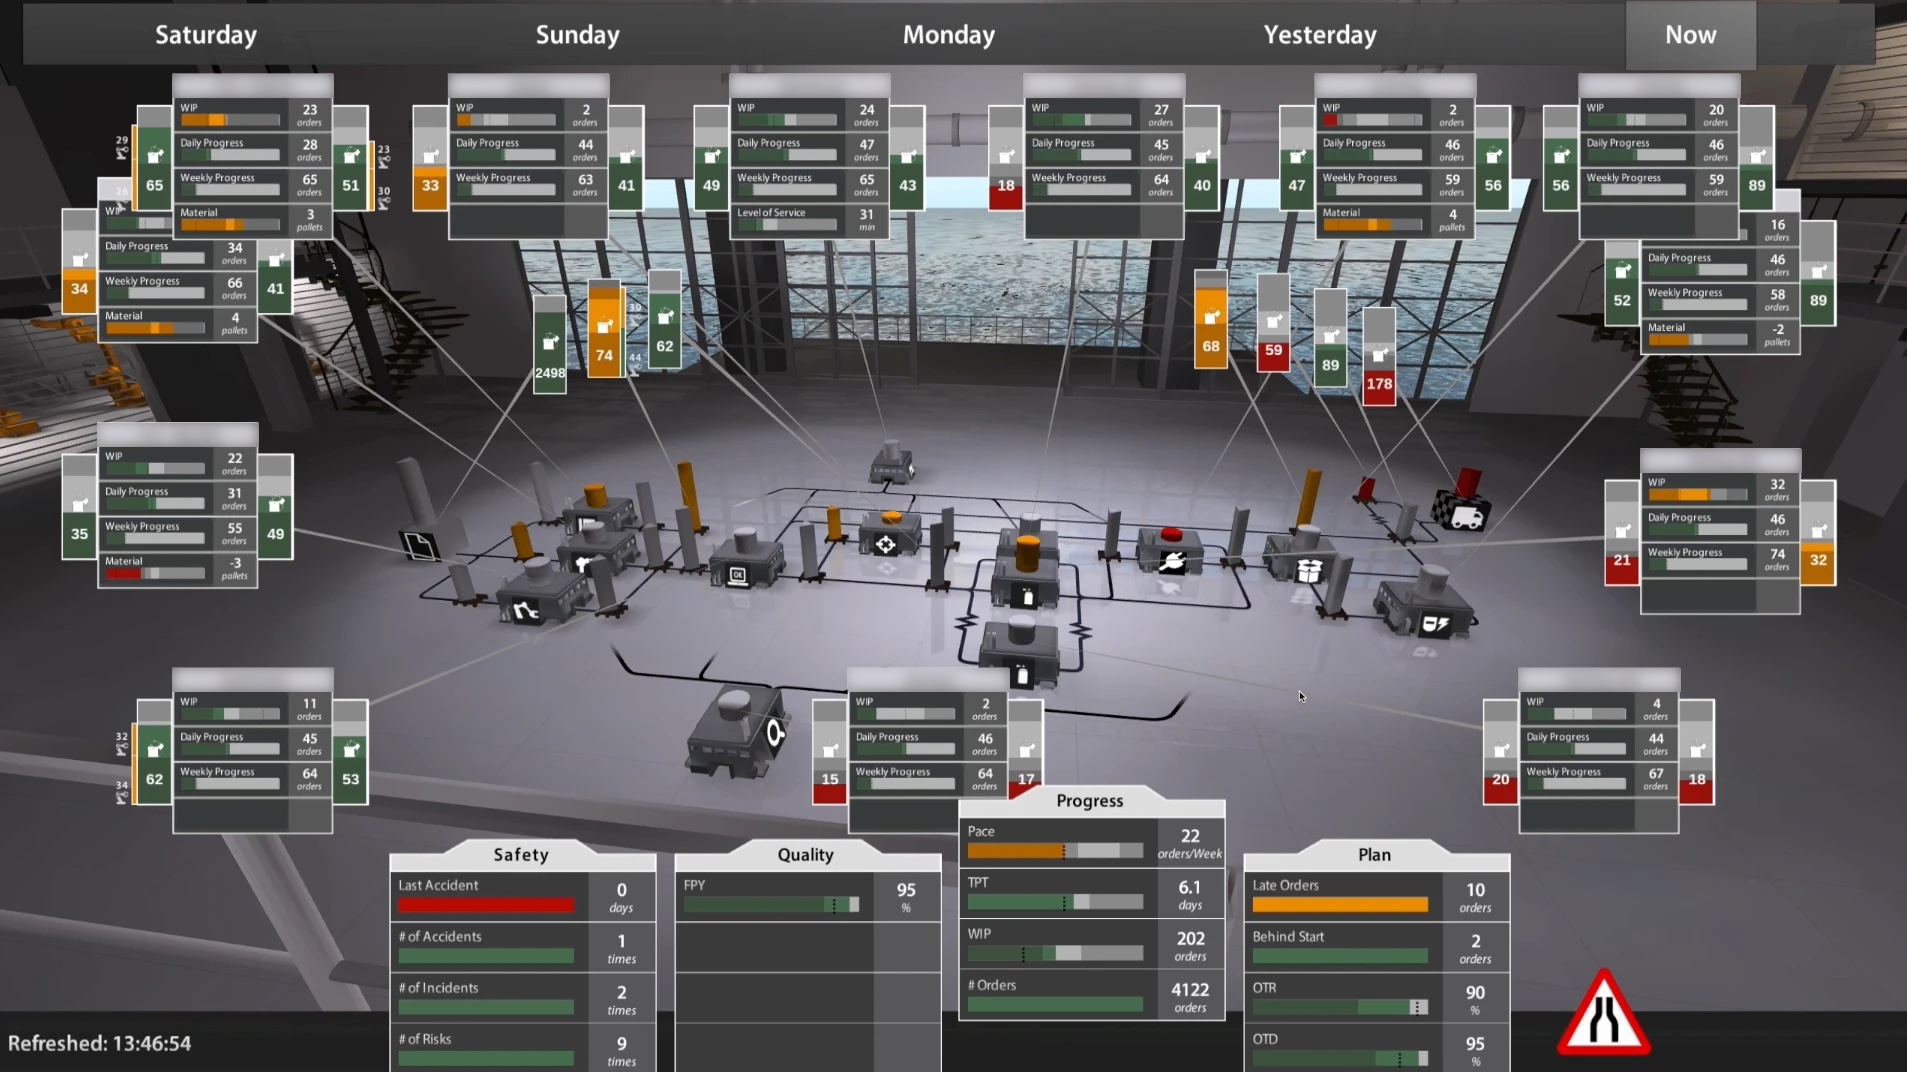
For close to a year I worked on a single project at ABB Corporate Research: a 3D view of a factory that let a production team see, at a glance, how their day was going.
Paper on the factory floor
In many factories, the state of production still lived on paper. Following up on problems and keeping an up-to-date picture of the day took time, and it was hard to see where things were getting stuck. The idea was a tool that showed the essential information digitally, so that in the morning meeting round the different people on the factory floor could get an overview of safety, quality, progress and the plan for the day and the week.
Listening first
I joined the team as a UX designer. We started by interviewing and observing production managers and workers, to understand how they worked. From that came the needs: to read the flow between production lines quickly, to spot bottlenecks, to know how the shift was going, to have support for the morning walks where the day's production is decided, and to take the information with them. Then came the wireframes and the first prototypes.
Building it in Unity 3D
Later I moved from designing the application to programming it, in Unity 3D, for both desktop and iPad. You could go from an overview of the whole factory down to a single line or buffer, filter customer orders by country, customer or model, and follow each order until it was shipped. 3D bars grew and shrank with the progress, quality, safety and plans of production, coloured by thresholds for each indicator, and markers let people point at where a problem might start.
Part of the prototype went into use on a real production line, and new functions kept being added.
Read more
- Ralph, M., Aranda Muñoz, Á., Timsjö, S., & Lundemalm, M. (2016). Visionary: 3-D visualization enhances production operations. ABB Review, 1/16, 49–52. Also in Spanish.
- The project also led to a book chapter on combining Scrum and user-centred design: Aranda Muñoz, Á., Nilsson Helander, K., de Gooijer, T., & Ralph, M. (2016). Integrating Scrum and UCD: Insights from two case studies. In G. Cockton, M. Lárusdóttir, P. Gregory, & Å. Cajander (Eds.), Integrating user-centred design in agile development (pp. 97–115). Springer.